From my daughter ChloÁ«, an undergraduate at the University of Michigan, comes a link to an interesting item at the UM website. The story is about physics professor Mark Newman, who left the Sante Fe Institute to join the UM faculty, and his work with maps and networks.
Among other projects, Newman has developed methods for parsing networks into communities:
…which yielded some surprises when used on real-world networks like political books, blogs, and metabolic systems. For instance, Newman found that when sorting books sold on Amazon into left- and right-wing groups, the most appealing book to conservative buyers was actually written by Democrat Zell Miller, who became notorious within his own party when he endorsed Bush in the last presidential election.
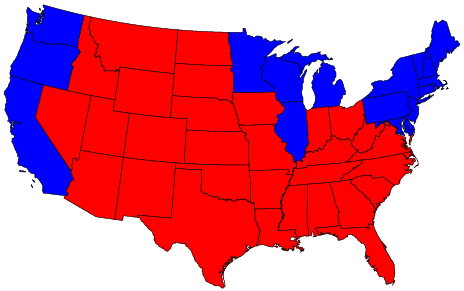
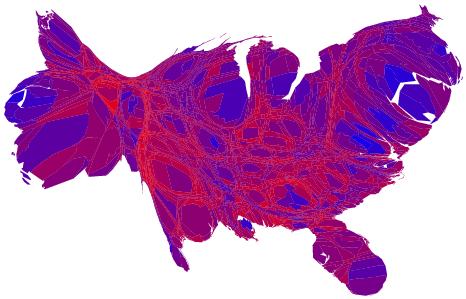
Newman also does interesting work with “cartograms”, which use geographical maps for the visual display of quantitative data. Here, for, example, is the familiar red-state/blue-state map of the 2004 election results:

But by the time Newman was done with it, it looked like this:

Take a look at the steps in this transformation here. You can also find some examples of social and economic cartograms here.
There is much, much, more, if you like. Newman suggests that if you are interested to see more cartograms,
you might like to visit the website of the Worldmapper Project, where a group of colleagues and I are gathering together an ever-growing collection of cartograms showing all sorts of aspects of the social, economic, and geographic world. The web site contains, among other things, downloadable posters of cartograms that you can print out, along with data sets, descriptions of the statistical analyses, and information about the methods used to produce the maps.
One Comment
Hello tto every body, it’s myy first visit of this website; thos web site carries amazing and actuhally fine data for visitors.